 |
| ||||||||||||||||||||||||||||||||||
Blog Entry# 1366085
Posted: Feb 11 2015 (00:29)
7 Responses
Last Response: Feb 14 2015 (13:59)
7 Responses
Last Response: Feb 14 2015 (13:59)
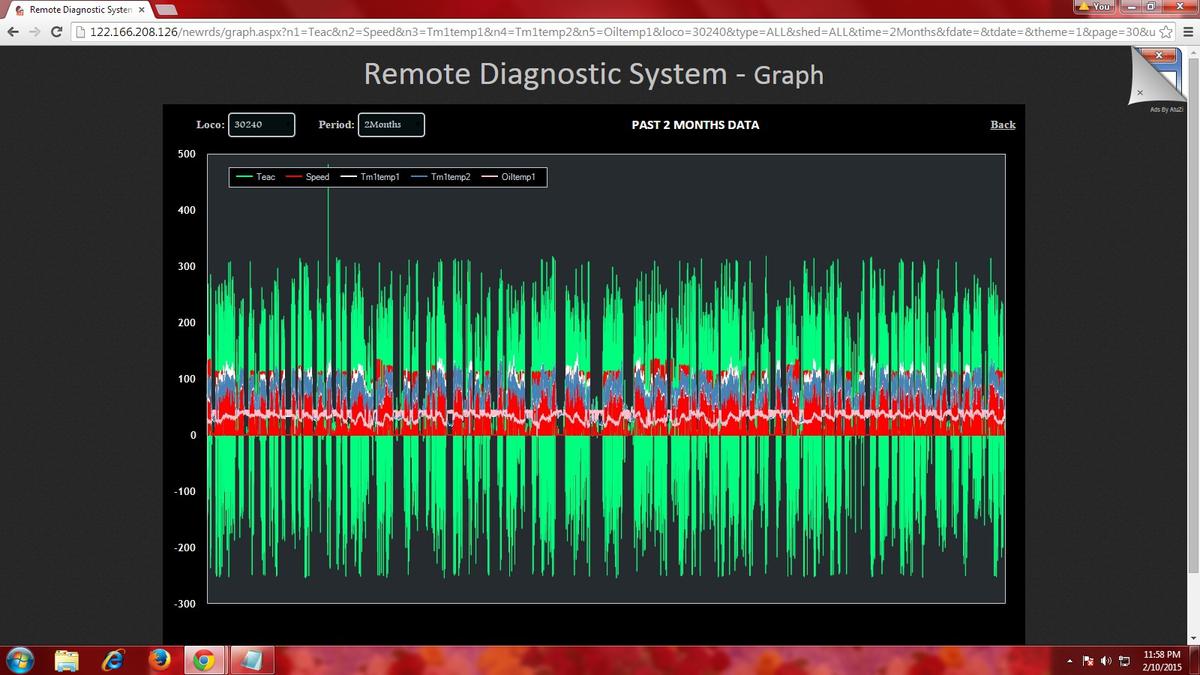
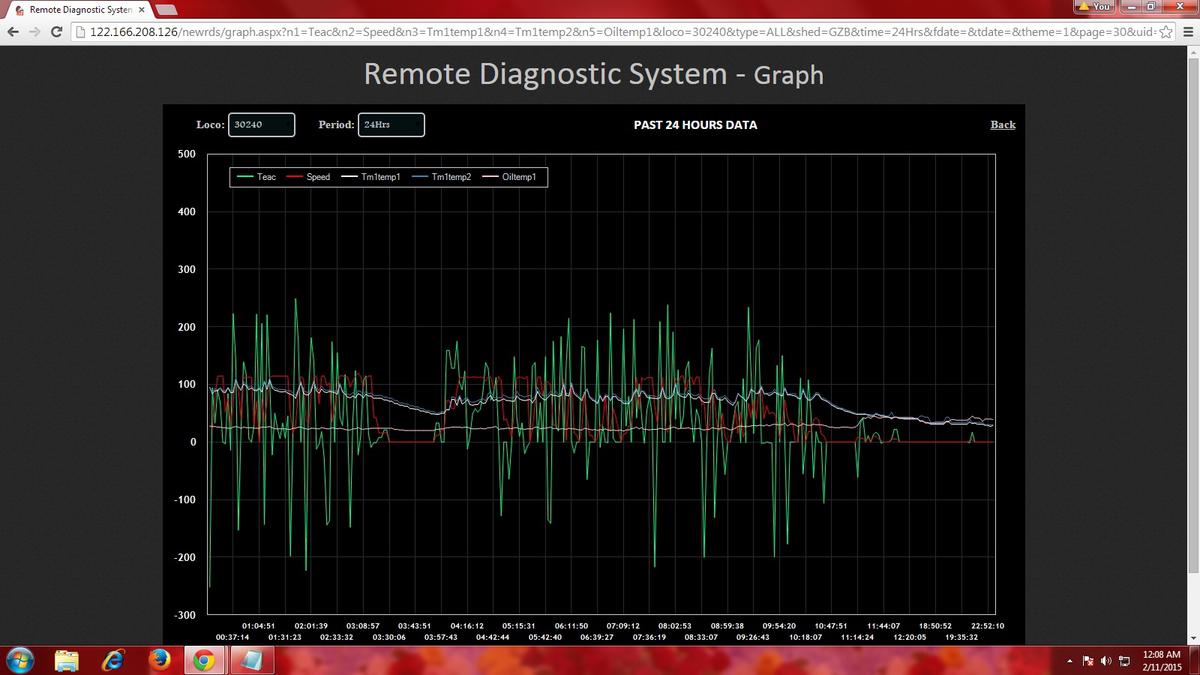
-----------------Website of Indian Railways for monitoring "All Technical Details" of all 3 Phase Locos when they are in Motion----------
The Images attached with this blog is the
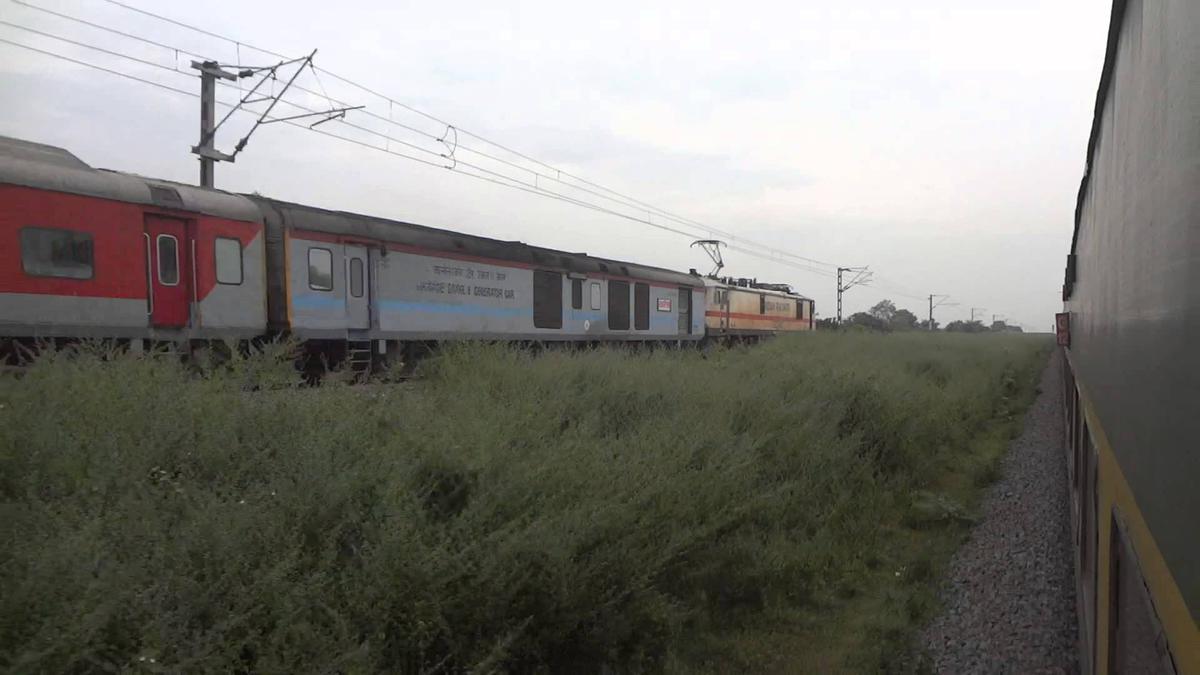
1 PAST 2 MONTHS DATA OF LGD WAP 7 30240 in Graphical Format(Screenshot taken in MS Paint)
2 PAST 24 HOURS DATA OF LGD WAP 7 30240 in Graphical Format(Screenshot taken in MS Paint)
These...
more...
The Images attached with this blog is the
1 PAST 2 MONTHS DATA OF LGD WAP 7 30240 in Graphical Format(Screenshot taken in MS Paint)
2 PAST 24 HOURS DATA OF LGD WAP 7 30240 in Graphical Format(Screenshot taken in MS Paint)
These...
more...
4 Posts
great...see the braking action and speed maintained by this WAP 7.....i think they are enough for handling speedy trains in India and govt can insist more on improving tracks and coaches than bullet trains as we have these three phasers
Your Observation is absolutely correct. The "Graph" exactly tells the same story. I also have the same impression and hope in future we should see more three phasers on Indian Railways and as per the latest info available in CLW official website, we have 210+ WAP 7's as yet hope in future this number will increase. We have 550+ WAG 9 this figure will also increase in future. Regarding WAP 5 the figure is 100+ I think. Hope RM will take initiative for introducing more 3 Phasers on IR but for that we have to wait till 26.02.2015 means 15 more days to go.
Let's hope for the best.
Thanks...
more...
Let's hope for the best.
Thanks...
more...
i am also hoping the same...i still remember the plan of running trains at 200kmph+ by ex RM Mr Dinesh Trivedi...his approach was very good..i think that has to be considered again...
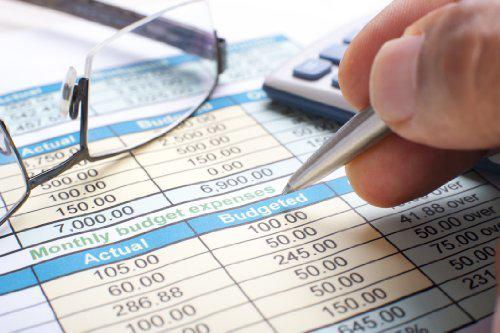
Exactly. Frankly speaking I also followed the idea of Ex RM Mr Dinesh Trivedi and prepared a "Charter of Demand relating to Budget 2015" in
/blog/post/1342011
Already point 14 and point 21 have been considered by the Railways as yet. Hope all my points will be considered in the ensuing Rail Budget to be tabled on 26.02.2015.
Attached Image
...
more...
/blog/post/1342011
Already point 14 and point 21 have been considered by the Railways as yet. Hope all my points will be considered in the ensuing Rail Budget to be tabled on 26.02.2015.
Attached Image
...
more...
Travel SAFE
1. RailFanning does NOT MEAN dangerous pics/videos.
2. Doorplating pics/youtube videos are strictly FORBIDDEN in IRI.
3. Take plenty of food pics and other safe pics.
4. Write human interest narratives to make the pics interesting.
5. Enjoy blogging and travelling SAFELY.
REMEMBER: YOUR LIFE is the most precious thing, NOT RailFanning.
Scroll to Top